The CO2 Speedometer
How has the Earth’s atmosphere changed during your lifetime?
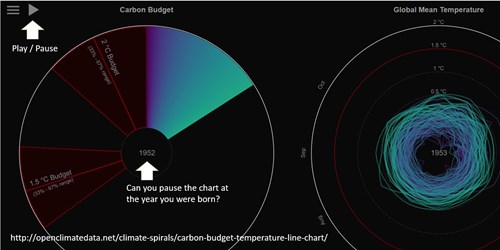
Discover the speed of rising Carbon Dioxide (CO2) concentrations with this clever interactive graphic which you can CLICK to pause and restart. To help you make sense of the speed of change, and our CO2 budget limits, here is a challenge for you.
- Click on the animation to pause on 2 dates:
- the year you were born
- the year 2019 when MDDC made its Climate Emergency declaration
- For each year, note the level of CO2 in the atmosphere.
- How much has it changed in your lifetime?
How fast have CO2 levels changed in your lifetime?
- Atmospheric CO2 concentration in 1876 was estimated to be 289 ppm (parts per million).
- 50 years later in 1926 it was around 306 ppm.
- By 1976 CO2 was at 332 ppm.
- By 2015 CO2 reached 399 ppm.
- By 2022 the CO2 concentrations were above 417 ppm.
Between 1876 and 1926 the mean rate of growth in CO2 concentrations, circa 0.34 ppm per year was set to accelerate. During 2021 the annual mean rate of growth (AMRG) was 2.38 ppm per year. During 2024 the AMRG was 3.33 ppm per year.
Now what?
This short article was just a way to help grasp the astounding scale of this atmospheric change. The animation illustrates why we have a Climate Emergency, because we do not have time to delay meaningful global action to address climate change.
Taking action is the best remedy against feeling overwhelmed – so what might you do? Carbon Savvy’s Mukti Mitchell suggests “how to increase your quality of life while doing your bit to reduce climate change” with his Top Ten Actions. (Here’s a flyer.) There’s no pressure to do the whole list all at once, but how about choosing your favourite first, and then enjoy the benefits of your lifestyle change? The Carbon Savvy carbon footprint calculator will help you track the difference you’re making to the climate, too.
- Link and image credit: http://openclimatedata.net/climate-spirals/
- You can check the trends at: https://gml.noaa.gov/ccgg/trends/gr.html

Table: Atmospheric CO2 Levels
|
Year |
Timeline |
CO2 Concentrations in Parts Per Million (ppm) |
|---|---|---|
|
1876 |
|
289 ppm |
|
1926 |
+50 years later |
306 ppm |
|
1976 |
+100 years later |
332 ppm |
|
2002 |
+126 years later |
372.5 ppm |
|
2022 |
+146 years later |
417 ppm |
|
2026 |
+150 years later = ? |
|
|
2076 |
+200 years later = ? |
|