The Council’s Carbon Footprint
How we monitor progress with the Council’s Carbon Footprint
Each year, the Council reports its ‘Greenhouse Gas Inventory’ or ‘Carbon Footprint’ - an assessment of its climate change impact as an organisation, measured in tonnes of carbon dioxide equivalent (tCO2e). The tCO2e is based on the Global Warming Potential (GWP) of different greenhouse gases over a 100-year period in comparison to carbon dioxide (CO2).
How is the report done?
Footprint assessments have been carried out independently by the Centre for Energy and Environment at the University of Exeter using internationally accepted methods, and cover Scopes 1, 2, and 3. Please note: a consistent methodological approach, combined with changes to official reference sources such as emissions factors may result in changes made in retrospect to figures published for previous years.
What are the results?
Here are the results for each year's report. The ‘baseline’ year was April 2018 - March 2019. Gross figures exclude offsets, such as solar power that we have exported off site. Nett emissions are calculated based on achieving reductions in greenhouse gas emissions linked to e.g. generating renewable energy.
The Nett Carbon Footprint (tCO2e) each year.
|
18/19 |
19/20 |
20/21 |
21/22 |
22/23 |
23/24 |
24/25 |
|
18495 |
17732 |
16144 |
18108 |
20147 |
17948 |
18364 |
Here are links to the Carbon Footprint reports for each year.
| April 2018 - March 2019 |
| April 2019 - March 2020 |
| April 2020 - March 2021 |
| April 2021 - March 2022 |
| April 2022 - March 2023 |
| April 2023 - March 2024 |
| April 2024 - March 2025 |
Notes on the latest analysis
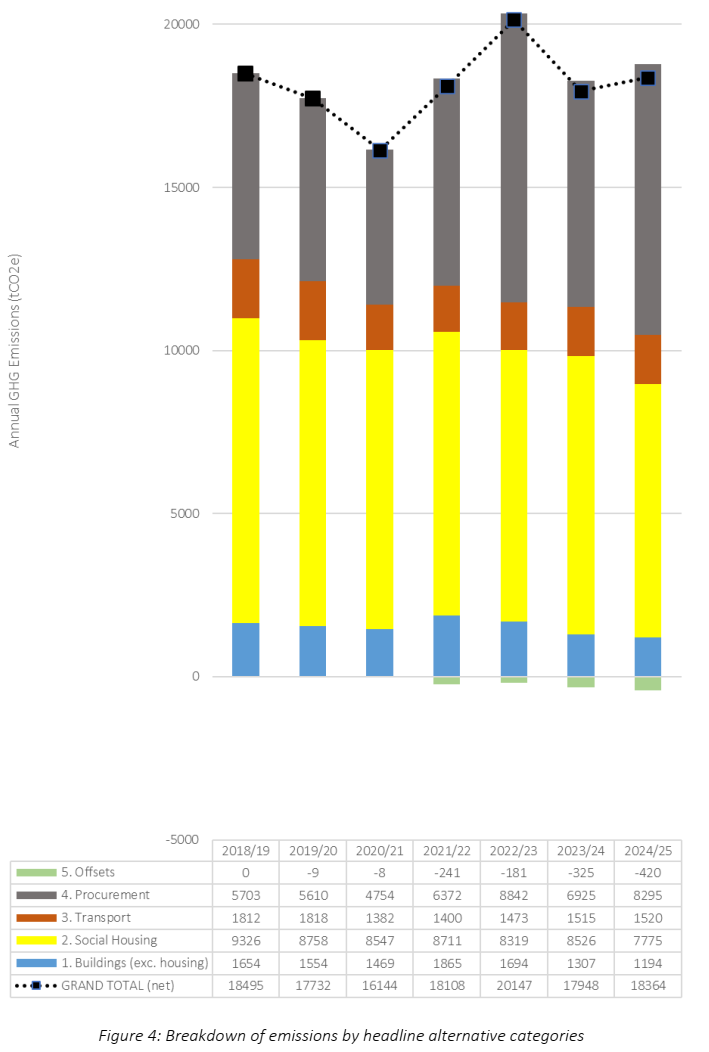
Net emissions for the 2024/25 financial year totalled 18,364 tCO2e. This was 2% higher than the previous year.
The chart and table for ‘headline alternative categories’ provides a useful overview of changes or trends in emissions for these categories, over time. Please refer to Figure 4 in the Results section of the 2024/25 report. (below)
Headlines from the latest changes as follows:
- Estimated emissions from the Procurement category increased by 1,370
tCO2e compared to the previous year, mainly due to increased spend and
revised emission factors. - Transport: emissions remained about the same.
- Social Housing: the footprint decreased by 751 tCO2e mainly due to a lower
assumed energy consumption per dwelling. - Buildings excluding housing: impact reduced by 113 tCO2e. Decarbonised
leisure centres stopped using gas during 2024/25. - Offsets: improved by 29% - cutting an extra 95 tCO2e. Decarbonised leisure
centres used more electricity, and as the Council buys green power there is a
carbon offset. The Council also exports some of its solar power.
Net emissions for elements in the Council’s direct control (comprising Council
Offices and Facilities; Transport; and Offsets) contributed just under 9% of the
2024/25 overall total footprint.
- The 1,589 tCO2e figure for 2024/25 is circa 35% lower than the 2,427 tCO2e
figure for the 2018/19 baseline year. (Almost 840 tCO2e less.) - Reductions in this emissions subset since 2018/19 came from Council Offices
and Facilities (from 1,098 to 705 tCO2e); and Offsets (from 0 to -420 tCO2e). - Since 2018/19 fleet impacts had hardly changed, although the Council now
serves circa 2,500 more households (up from 35,650 to 38,150).
 |
|
| Figure 4 from the Results section of the 2024/25 report. |
The following table shows the 2024-2025 Carbon Footprint figures from Figure 4 in the Results section.
This is a breakdown of emissions by Headline Alternative Categories.
|
Percentage |
Headline Alternative Categories |
2018/19 |
2019/20 |
2020/21 |
2021/22 |
2022/23 |
2023/24 |
2024/25 |
|
-2% |
5. Offsets |
0 |
-9 |
-8 |
-241 |
-181 |
-325 |
-420 |
|
44% |
4. Procurement |
5703 |
5610 |
4754 |
6372 |
8842 |
6925 |
8295 |
|
8% |
3. Transport |
1812 |
1818 |
1382 |
1400 |
1473 |
1515 |
1520 |
|
41% |
2. Social Housing |
9326 |
8758 |
8547 |
8711 |
8319 |
8526 |
7775 |
|
6% |
1. Buildings (exc. housing) |
1654 |
1554 |
1469 |
1865 |
1694 |
1307 |
1194 |
|
|
Grand Total (net) |
18495 |
17732 |
16144 |
18108 |
20147 |
17948 |
18364 |